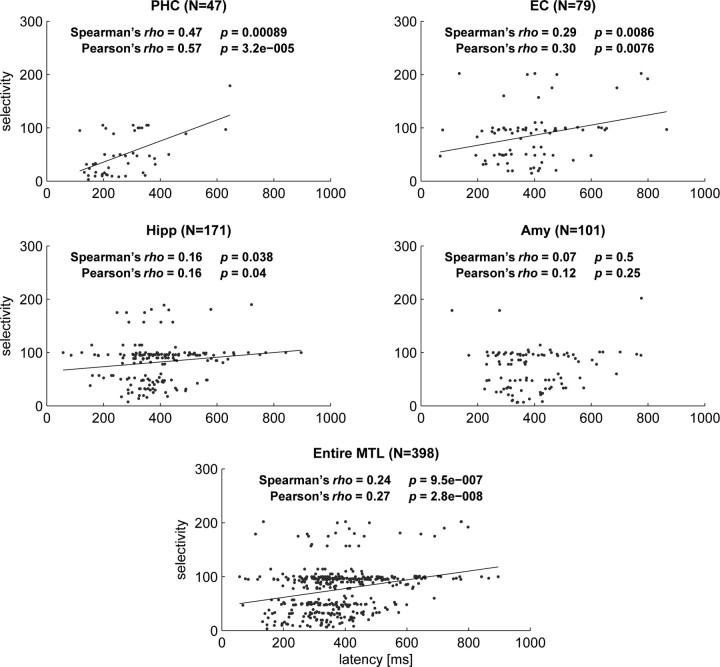
Figure 5.
Scattergrams displaying selectivity versus latency for the four MTL regions and the entire MTL. Parametric (Pearson's) and nonparametric (Spearman's) correlation analysis showed a significant relationship in all regions except the amygdala. Black solid lines show the linear regression slopes for regions with significant correlation. For this analysis selectivity was operationally defined as the reciprocal value of the percentage of stimuli to which a given cell responded. Note that the horizontal band around a selectivity value of 100 represents cells that responded to only one stimulus in sessions in which ∼100 stimuli were shown. PHC, Parahippocampal cortex; EC, entorhinal cortex; Hipp, hippocampus; Amy, amygdala.

