
Figure 2. FcRn distribution in yolk sac and placenta.
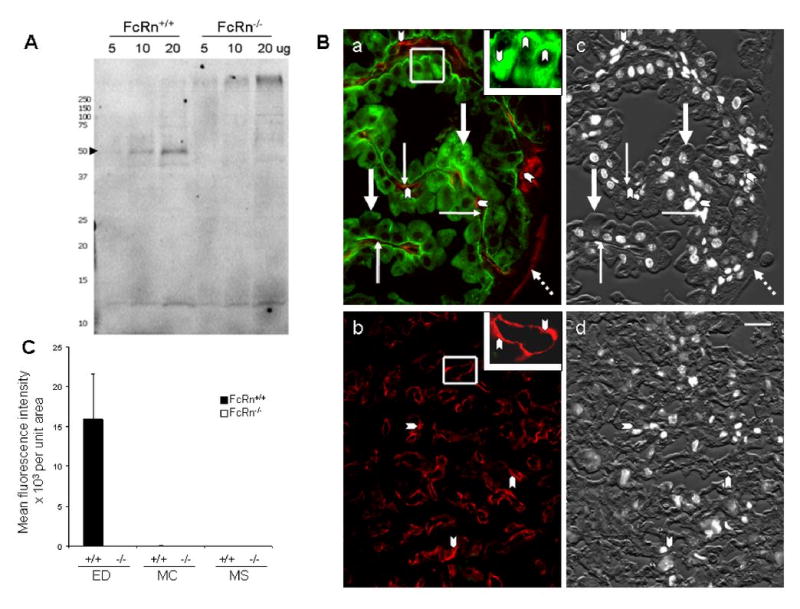
Panel A: Immunoblot of FcRn protein from mouse intestine. Three different amounts of lysate from FcRn+/+ (lane 1, 2 and 3) and FcRn−/− pups (lane 4, 5 and 6) were subjected to SDS-PAGE electrophoresis and immunoblotting with hamster anti-mouse FcRn serum. FcRn is marked with an arrowhead. Replicate samples from 3 FcRn+/+ and 3 FcRn−/− animals gave identical results. Panel B: Localization of FcRn in yolk sac and placenta. Sections of fixed yolk sac (a) and placenta (b) from day 19-20 FcRn+/+ conceptuses were stained simultaneously with hamster anti-mFcRn antiserum (green) and with chicken anti-CAV1 antibody (red) for endothelium. FcRn was restricted to the apical and basal portions of endodermal cells (thick arrows) in the yolk sac (a). No FcRn signal can be found in yolk sac mesenchyma (thin arrows), in endothelium marked by CAV1 labeling (arrow heads), or in mesothelium (broken arrows), also marked by CAV1 labeling (a). The inset of panel (a), containing a higher magnified view of an outlined area of yolk sac, illustrates the dense green labeling in apical and basal areas of endodermal cells (arrowheads). The lack of green in panel (b) indicates that no FcRn is expressed in the placental labyrinth. Arrowheads point to the endothelium marked by CAV1 labeling (red). The inset of panel (b) shows a higher magnified view of a CAV1-labeled area. Panels c and d are black and white renditions of the corresponding DIC and DAPI stained images of a and b merged to illustrate the morphology of the tissue. Hamster pre-immune serum showed nothing more intense than the nonspecific staining seen with the secondary antibody alone (not shown). Bar = 20 μm. Panel C: Quantification of immunofluorescence images. Yolk sac sections from FcRn+/+ and FcRn−/− animals were stained with hamster anti-mFcRn antiserum and FITC-goat anti-hamster IgG. Fluorescence images were collected from representative sites of the three major cellular areas of the yolk sac; i.e., endodermal (ED), mesenchyma (MC), and mesothelium areas (MS). The images were quantified, the numbers averaged for each area (mean fluorescence intensity), and the areas compared by normogram. We noted a very faint patchy green fluorescence in the ED of FcRn−/− yolk sacs far below the intensity of the FcRn+/+ yolk sacs (mean fluorescence intensities of 6,000 ± 6 in FcRn+/+ ED, while mean fluorescence intensities of MS and MS areas were < 30). This patchiness may indicate cross-reactivity of the antibody with another component of the ED, perhaps similar to that described by the originator of the hamster anti-mFcRn antibody (11).