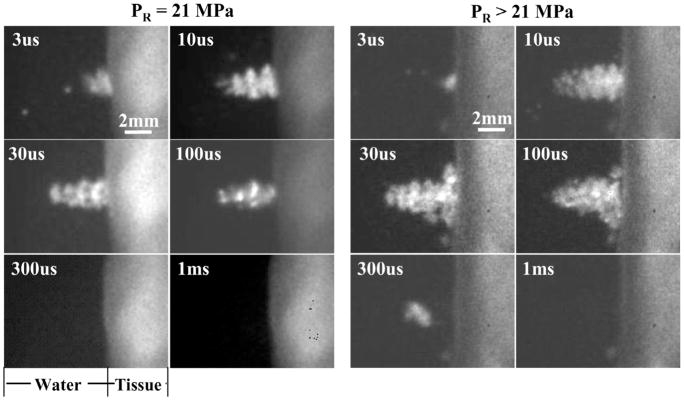
Fig. 8.
Images of bubble clouds generated by a 10-cycle (14-μs) pulse at PR of 21 MPa (left) and >21 MPa (right) at a tissue-water interface. Each image was taken at a specific time delay (labeled) after the arrival of the histotripsy pulse at the transducer focus (i.e., tissue surface). The bubble cloud was larger and longer in duration at higher PR.

