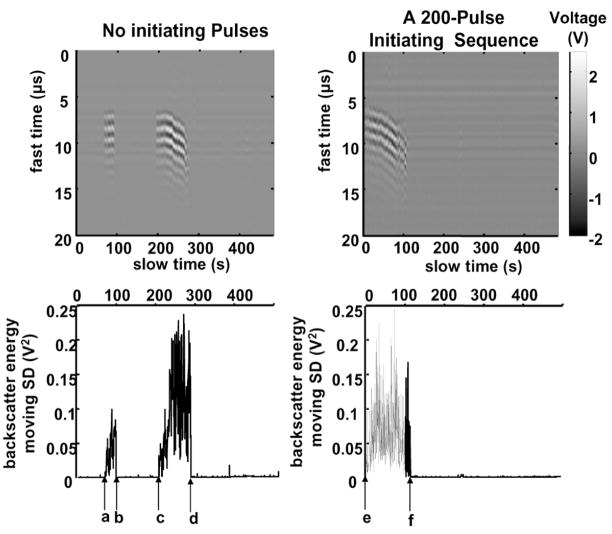
Fig. 3.
Acoustic backscatter signals received by the 5-MHz, passive transducer to illustrate initiation and extinction of the variable acoustic backscatter. Panels A and B show examples of backscatter in a fast time and slow time display, using pulses at ISPPA of 4000 W/cm2 without and with a 200-pulse, 9000 W/cm2 initiating sequence, respectively. Each vertical line shows the backscatter recorded in a range gated 20-μ s window in which voltage output of the 5-MHz transducer is encoded in gray scale. The x-axis is treatment time in seconds. The shift of backscatter at 200 to 300 s is likely due to the movement of cavitating bubbles away from the transducer as a result of a combination of radiation force and the progression of tissue erosion. Because the applied pressure is high, the associated acoustic radiation force could push these bubbles away from the transducer significantly. In addition, the tissue front surface, which serves as a boundary to hold cavitating bubbles, shifts away from the transducer as erosion progresses. Panels C and D represent the backscatter energy moving standard deviation as a function of treatment time, which is used to detect initiation and extinction of the backscatter in Panels A and B, respectively. For the treatment without any initiating sequence, as shown in Panels A and C, the variable backscatter was initiated at “a”, extinguished at “b”, spontaneously reinitiated at “c”, and tissue was perforated at “d”. For the treatment with a 200-pulse initiating sequence, as shown in Panels B and D, the variable backscatter was initiated rapidly (“e”) by the initiating sequence, and tissue was perforated at “f”. A PD of three cycles, a PRF of 20 kHz, and gas concentration range of 37%–47% were used in both treatments.

