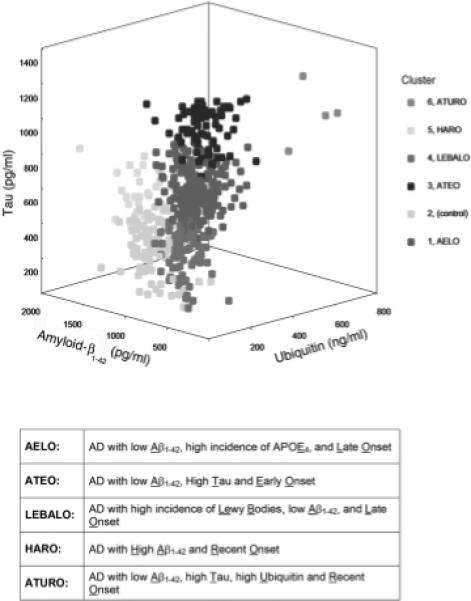
Fig. 2.

Three-dimensional representation of the five AD subgroups (Clusters 1, 3, 4, 5 and 6) and the controls (Cluster 2). (Reproduced with permission from Iqbal et al., 2005, Annals of Neurology, 58, 748−757.)

Three-dimensional representation of the five AD subgroups (Clusters 1, 3, 4, 5 and 6) and the controls (Cluster 2). (Reproduced with permission from Iqbal et al., 2005, Annals of Neurology, 58, 748−757.)