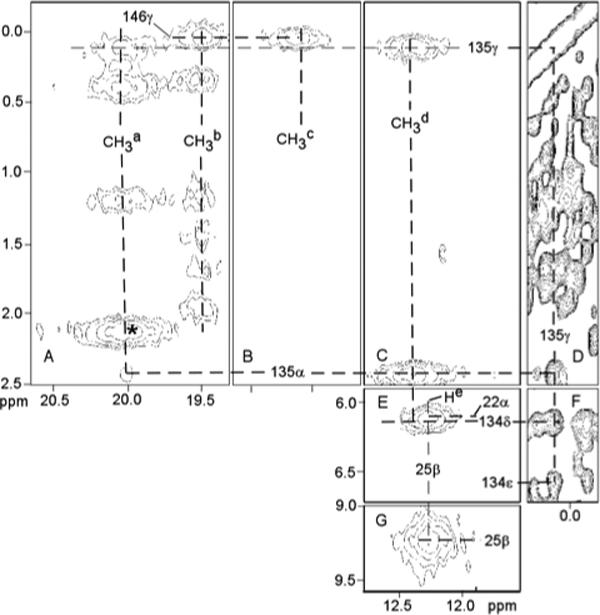
Figure 7.

Portion of the 600 MHZ 1H NMR NOESY spectrum (mixing time 40 ms; repetition rate 25 s−1) of D140A-hHO-DMDH-N3 in 2H2O, 100 mM in phosphate, pH 7.1 at 30°C illustrating the DMDH contacts to the four low-field resolved methyls labeled Ma-Md to key active site residues (A-C, E, F); as well as key intra Thr135 (D), Thr135 to Tyr134 (F) and both inter His25 (G) and His25 to Lys22 contacts (E). The peak marked * possibly arises from 2CH3.
