
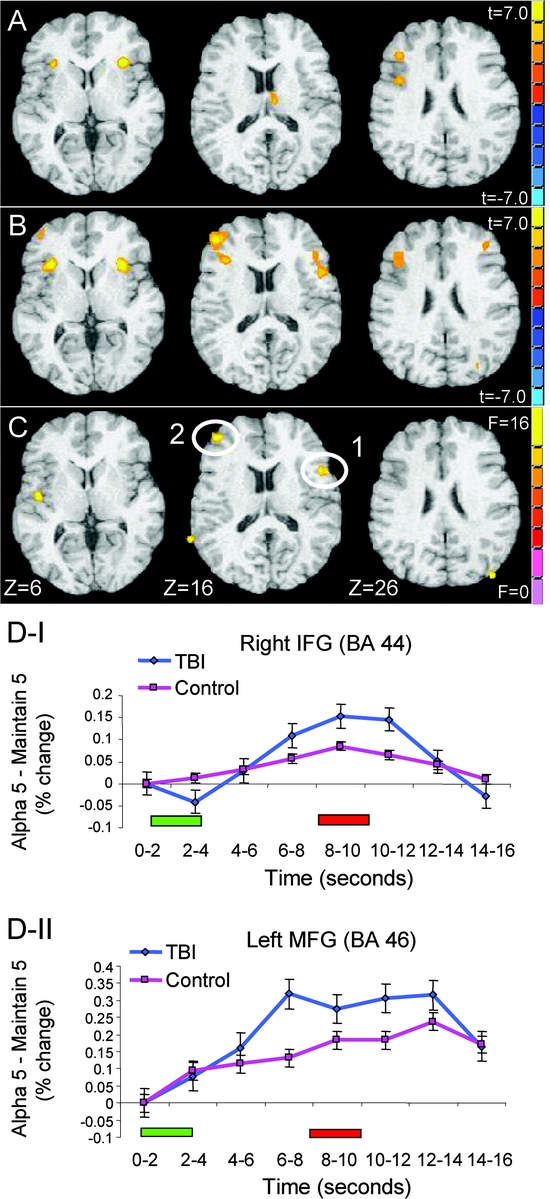
Figure 3 Areas of maximal BOLD signal change in the executive demand contrast (i.e., alphabetize > maintain conditions), collapsed across set size
(A) Control subjects. (B) Traumatic brain injury (TBI) patients. (C) Areas demonstrating a significant group × executive demand interaction. All suprathreshold cluster maxima for each group and the interaction are reported in table 2. The right side of the brain is displayed on the right side of the image. (D.1 and D.2) Temporal differences (% change in blood oxygen level–dependent [BOLD] signal) between alphabetize and maintain set size 5 conditions for control subjects and TBI patients, cross-referenced to numbers as specified in panel C. The green bar below the x-axis represents the onset of stimulus presentation; the red bar represents probe onset. IFG = inferior frontal gyrus; MFG = middle frontal gyrus.