
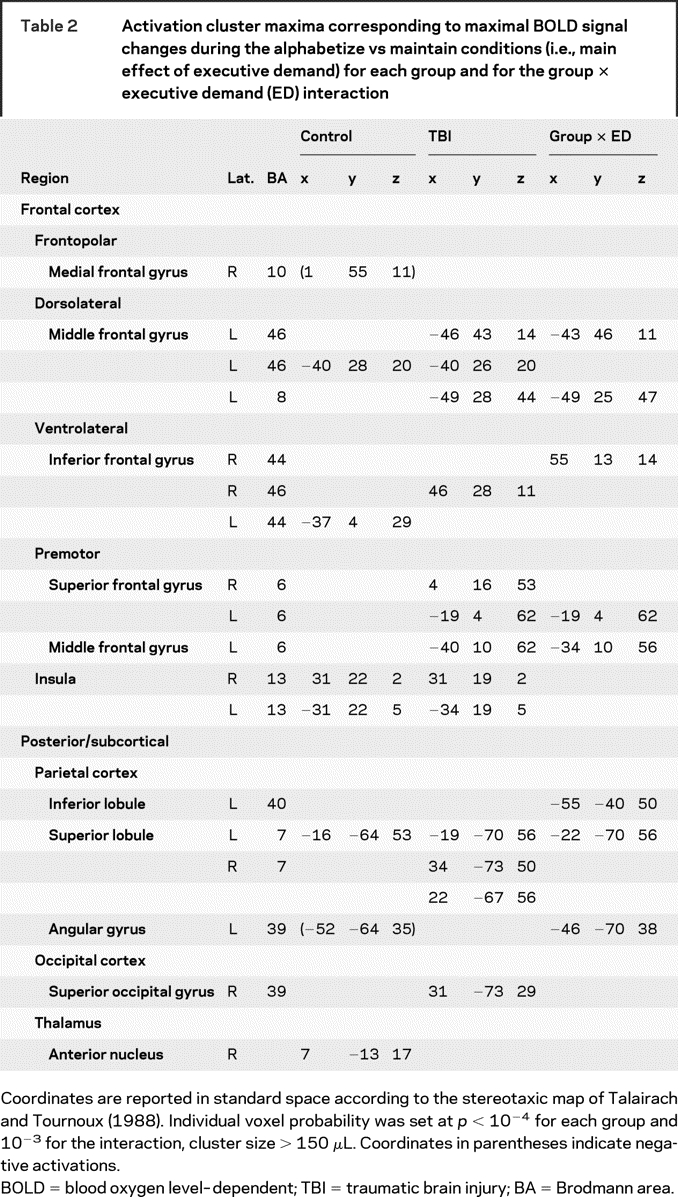
Table 2 Activation cluster maxima corresponding to maximal BOLD signal changes during the alphabetize vs maintain conditions (i.e., main effect of executive demand) for each group and for the group × executive demand (ED) interaction
Official websites use .gov
A
.gov website belongs to an official
government organization in the United States.
Secure .gov websites use HTTPS
A lock (
) or https:// means you've safely
connected to the .gov website. Share sensitive
information only on official, secure websites.
Table 2 Activation cluster maxima corresponding to maximal BOLD signal changes during the alphabetize vs maintain conditions (i.e., main effect of executive demand) for each group and for the group × executive demand (ED) interaction