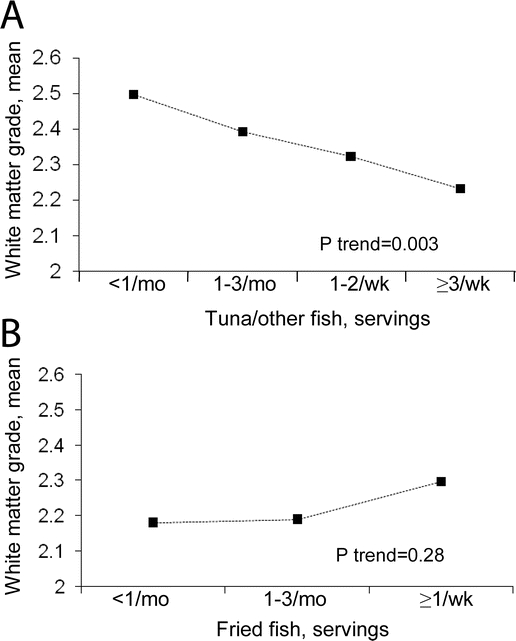
Figure 2 White matter grades according to fish consumption
Adjustments were made for fried fish or tuna/other fish consumption and age, sex, race, enrollment center, diabetes, education, smoking status, pack-years of smoking, body mass index, coronary heart disease at the time of MRI, alcohol use, physical activity, energy intake, meat consumption, and vegetable consumption.
