
Figure 3. Genotype comparisons of the three measures of locomotor response to MK-801.
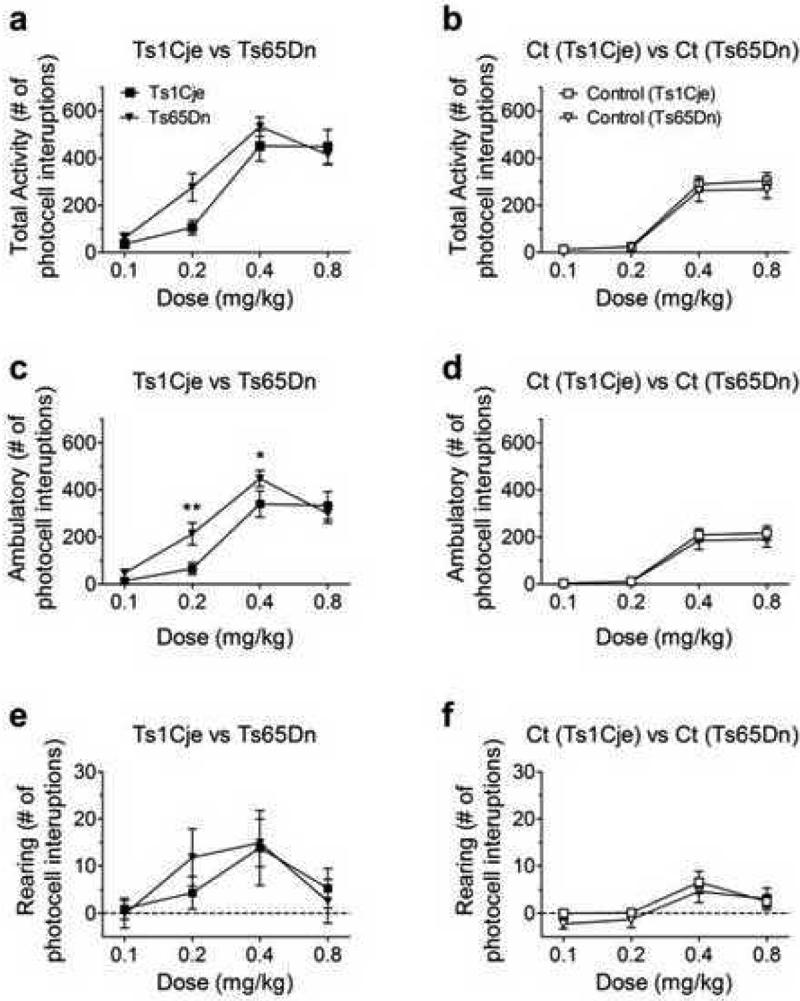
(a, c, e) Comparison of Ts1Cje (n=11) and Ts65Dn (n=15) for (a) total locomotor activity: no significant effect of genotype, (c) ambulatory activity: significant effect of genotype; post hoc comparisons revealed significant differences at 0.2mg/kg p<0.01 and 0.4mg/kg p<0.05, and (e) rearing activity: no significant effect of genotype. (b, d, f) Comparison of euploid controls from Ts1Cje (n=11) and Ts65Dn (n=15) mice: (b) total activity, (d) ambulatory activity, (f) rearing activity: genotype had no significant effect on any measure. Data for Ts65Dn total activity are taken from Costa et al (2008); they have been reanalyzed here separating ambulatory and rearing activities.