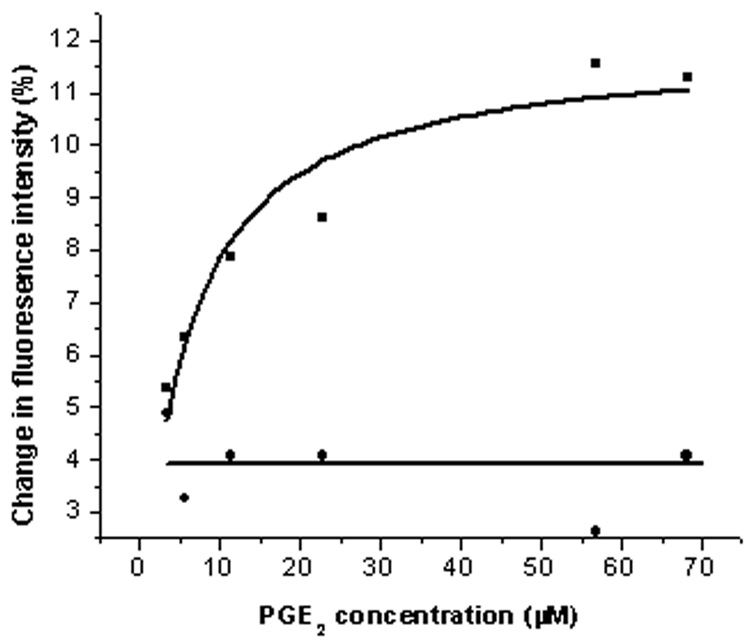
Fig.3.
Fluorescence spectroscopic of PGE2 with the synthetic peptide (constrained and crude). The fluorescence enhancement of the synthetic constrained peptide (0.1 mg/ml, squares, Kd 5.12) by the addition of its ligand (3.4– 68.1µM) was plotted. The non-significant fluorescence changes of the non cyclised EP3 eLP2 peptide (0.1 mg/ml, circles) is also plotted.

