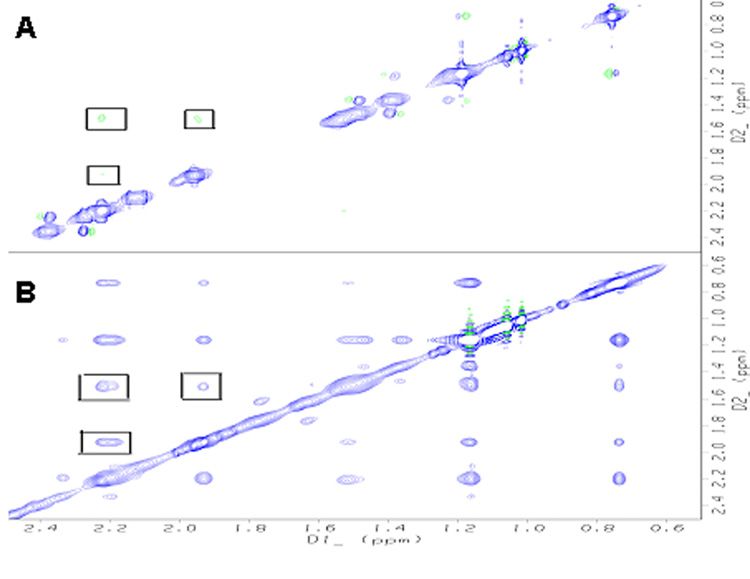
Fig.4.
NOESY spectra (A) The cross-peaks (In rectangles) of PGE2 shown as negative (green) phases (fast tumbling rate), compared to the diagonal. (B) The cross-peaks of PGE2 interacted with EP3 eLP2 peptide are shown as the positive phase (blue phases), (slow tumbling rate). Peaks indicate extra intra-molecule NOEs of the PGE2 interaction with EP3 eLP2.

