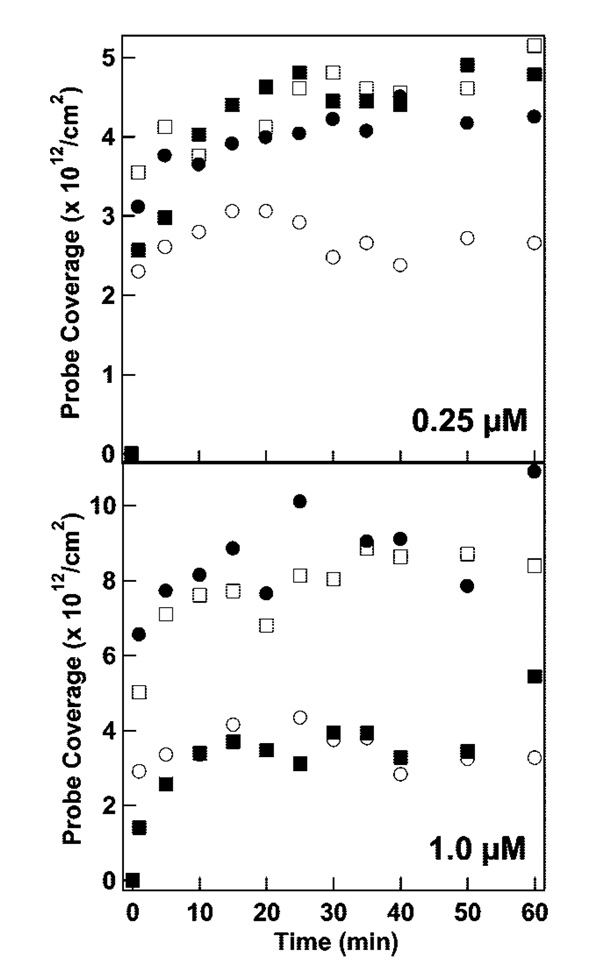
Figure 5.
Beacon probe attachment to Au/Ag nanowires as a function of time in 0.3 M NaCl at initial probe concentrations of 0.25 µM (top) and 1.0 µM (bottom). Symbols represent different probes sequences: HIV (filled circles), SARS (filled squares), INF B (open circles), and HCV (open squares) probes.

