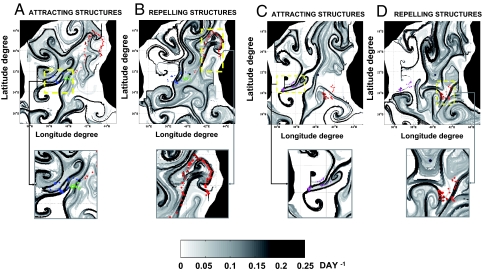
Fig. 2.
Overlays of seabird positions on FSLE maps. (A and C) Backward integration in time for FLSE computation (d−1). (B and D) Forward integration in time (d−1). A and B, week of September, 24, 2003. C and D, week of October, 6, 2003. Circles represent seabird trajectories and triangles foraging patches. Each color represents the tag of a different bird (red, tag 8023; blue, tag 16255; green, tag 11377; magenta, tag 19827).

