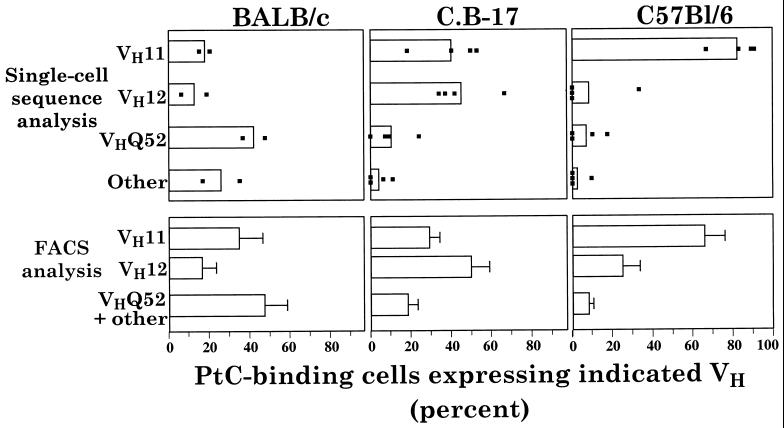
Figure 1.
VH gene family expression among PtC-binding B cells. (Upper) Bars represent the average VH family representation based on single-cell data from individually sorted PtC-binding cells. VH genes other than VH11, VH12, and VHQ52 are designated “Other.” Number of FACS-sorted individual (single) cells analyzed by RT-PCR and sequencing for each strain: 43 and 58, from two BALB/c pools (5 and 9 animals); 19, 17, 33 and 36, from four C.B-17 mice; and 15, 12, 10, and 10 from 4 C57BL/6 mice. Each point in the figure represents the VH family frequency found for a single mouse or pool of mice (BALB/c). (Lower) Bars with standard deviations represent the VH family representation among all PtC-binding cells determined by FACS for individual mice and averaged for the figure. Number of mice analyzed: 12 BALB/c, 8 C.B-17, and 6 C57BL/6.

