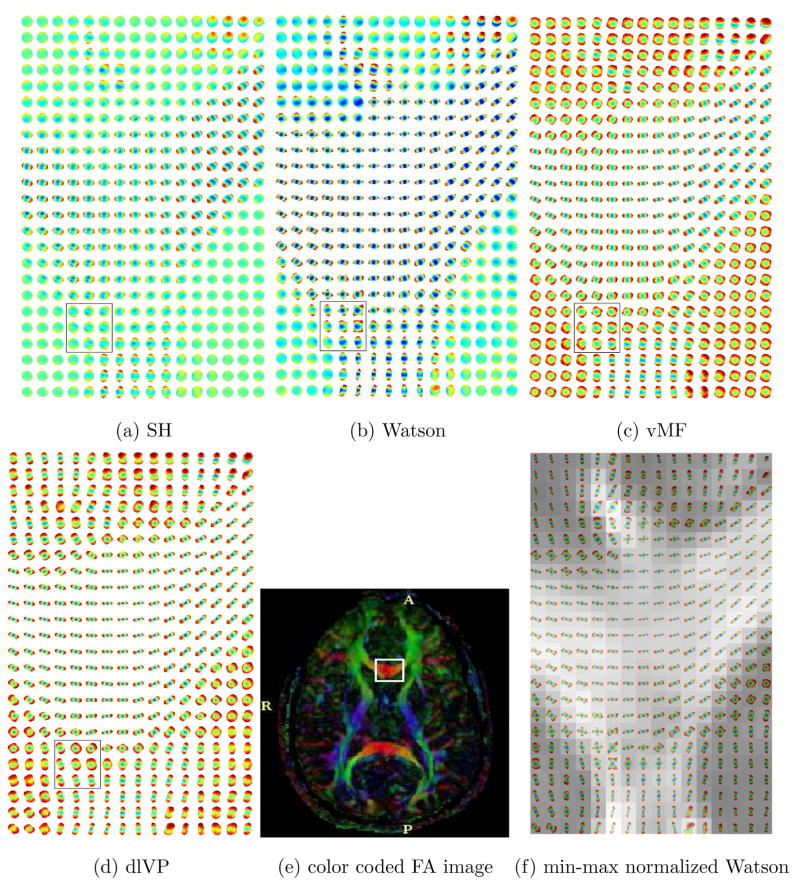
Fig. 14.
Estimated ODF for real data with 110 gradient directions. The ROI (genu of the corpus callosum) is taken from the color coded DTI slice shown in (e). In (f), ODF has been visualized using the min-max normalization as given in [37]. A zoomed version of the rectangular region shown in (a)–(d) can be seen in Figure 15.

