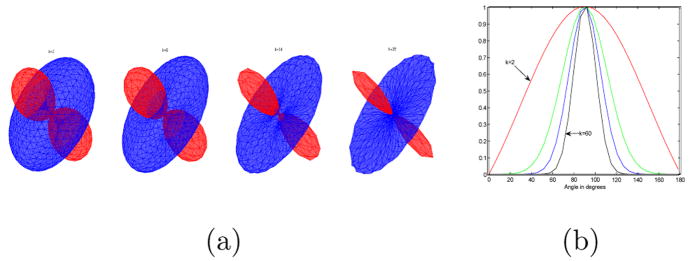
Fig. 6.
(a) The Signal (blue) and the corresponding ODF (red) for k = 2, 6, 14, 35 (left to right). (b) Shows the support of the kernel for different values of k. x-axis is the angle in degrees, while y-axis gives the value of the kernel (12). Note the decrease in support as k increases.

