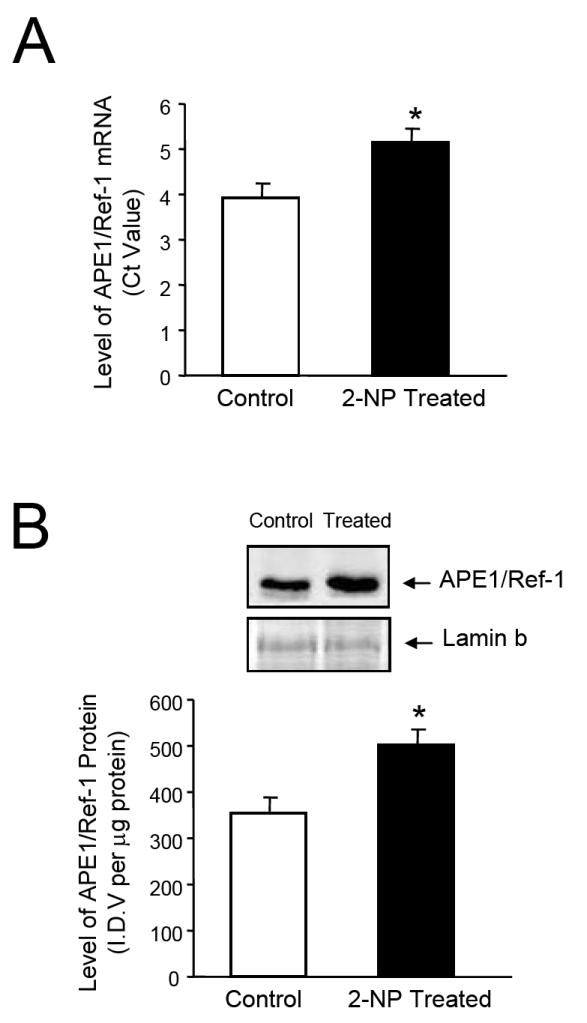
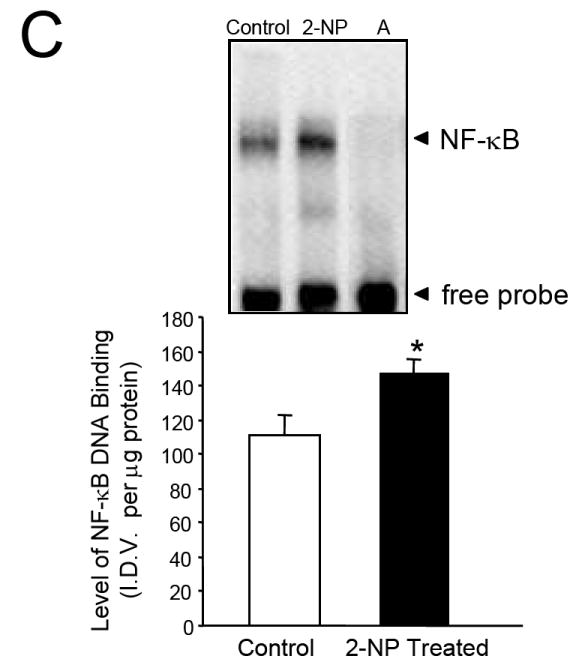
Fig. 1.


Expression and activity of APE1/Ref-1 in response to 2-NP in vivo. (A) APE1/Ref-1 mRNA expression was quantified using a real-time PCR and the data were normalized using GAPDH. Values represent an average (± S.E.M.) for data obtained from 5 mice in each group (B) The level of the 37-kDa APE1/Ref-1 protein in 200 μg of liver nuclear extract as determined by western blot analysis. Values represent an average (± S.E.M.) for data obtained from 5 mice in each group (C) The level of APE1/Ref-1 redox-activation of NF-κB in 10 μg of live nuclear extract as determined using EMSA. Values represent an average (± S.E.M.) for data obtained from 5 mice in each group and are representative of separate independent experiments. (I.D.V.): integrated density value corresponding to the level of APE1/Ref-1 protein as quantified by an AlphaInnotech ChemiImager™; Lane A: nuclear extracts incubated in the presence of 100X molar excess of unlabeled NF-kB consensus DNA to confirm binding specificity; (*): value significantly different from control, wild-type mice at P < 0.05; (**): value significantly different from control, Apex+/- mice at P < 0.05. Lamin B protein level served as nuclear protein loading control. The picture depicts the representative sample from each group.
