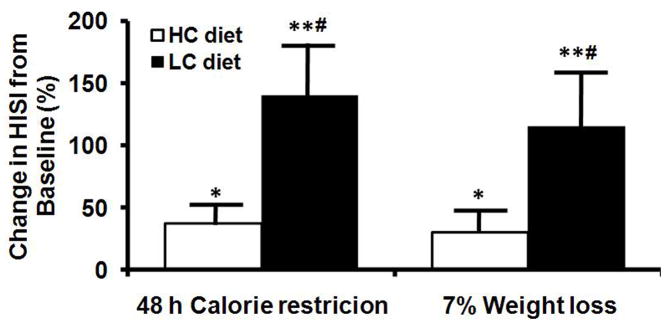
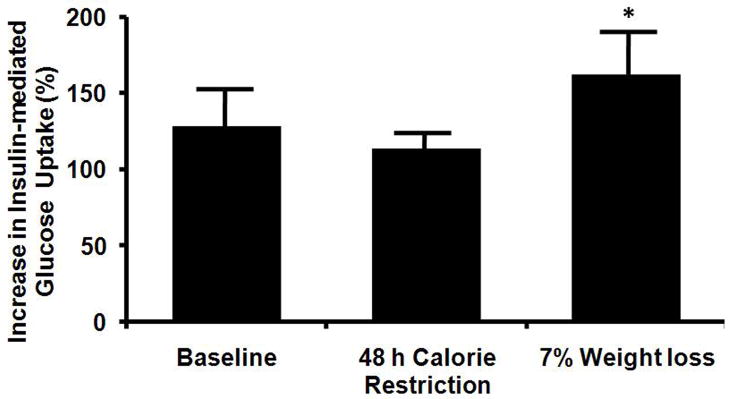
Figure 3.
Hepatic insulin sensitivity index (HISI) (top panel) in subjects consuming ether a high-carbohydrate or low-carbohydrate diet and changes in insulin mediated glucose uptake, an index of skeletal muscle insulin sensitivity, in both groups combined (bottom panel) after 48 h and ~11 wks (7% weight loss) of calorie restriction. Value significantly different from baseline value: * P<0.05, ** P<0.001. Value significantly different from value in HC group, # P<0.05.


