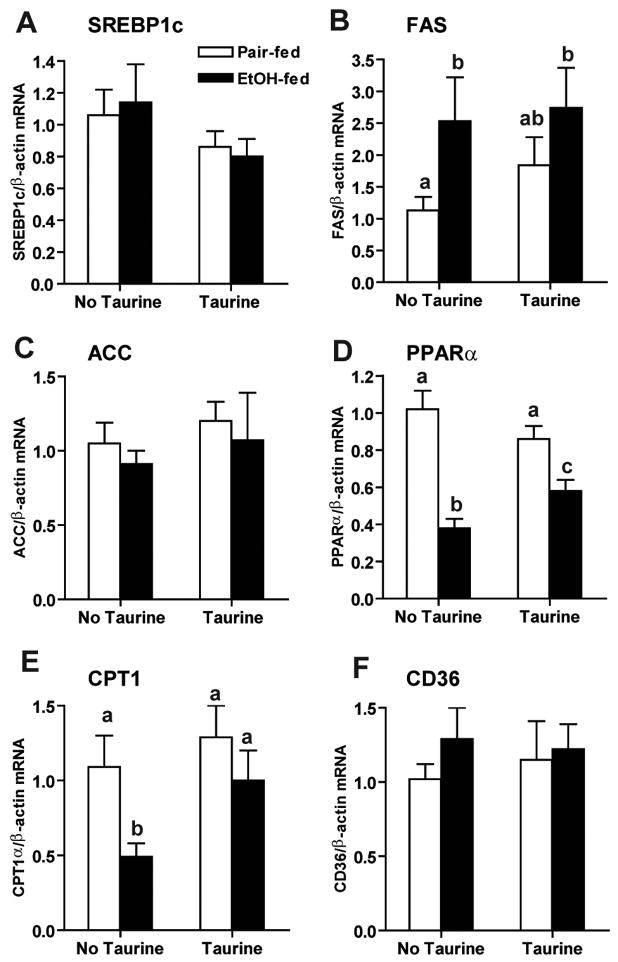
Figure 8. Taurine partially reversed ethanol-induced decrease in fatty acid oxidation.
SREBP1 (A), FAS (B), ACC (C), PPARα (D), CPT1α (E) and CD36 (F) mRNA levels in liver were measured by real-time PCR and then normalized to β-actin mRNA level. Values represent means ± SEM, n=5–6. Values with different letters are significantly different from each other, p<0.05.

