
Fig 3.
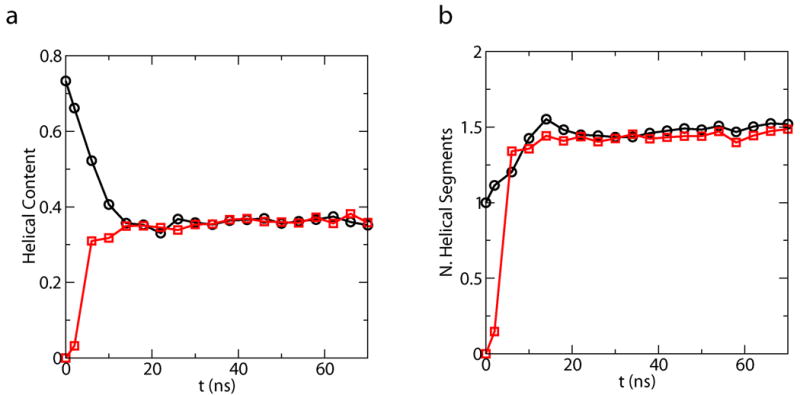
Convergence of the average helical properties as a function of time at 300K. Helix properties at each conformation is defined according to classical LR counting theory. Plots obtained from simulations starting from the helix structure (black, circle) and the coil structure (red, square) are displayed for (a). average helical content. (b). average number of helical segments.