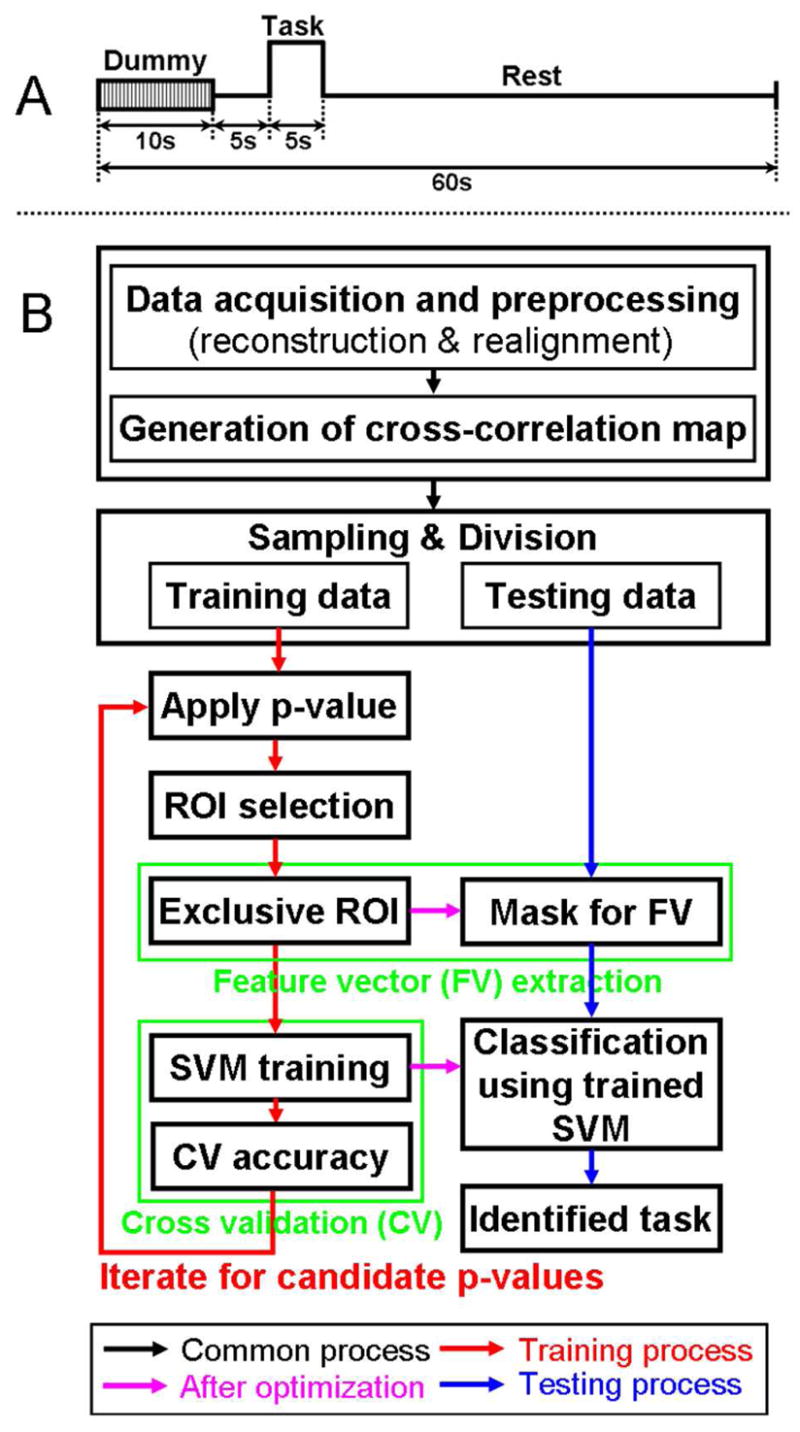
Figure 1.

(A) A timing diagram of the proposed fMRI study based on single trial-based paradigm and (B) a flow diagram of data processing for automated classification. First, reconstruction, realignment, and generation of cross-correlation maps were commonly applied (black arrow) for all fMRI data acquisitions (42 scans). Then, 30 different combinations of training data (24 scans) and testing data (18 scans) were prepared to examine a range of classification results. Using the 24 scans during the training process (red arrow), the optimal ROIs and SVM parameters were determined from the maximum cross validation accuracy throughout p-values (p<0.05, p<0.01, p<5×10⁻³, p<10−3, p<5×10⁻⁴, and p<10−4). These optimized parameters were applied to the subsequent classification of the testing data (remaining 18 scans; magenta arrow). During the consequent testing process (blue arrow), the testing data was entered into the trained SVM. Then, a hit or miss was determined by comparing the index of the identified (classified) task and type of original testing data.
