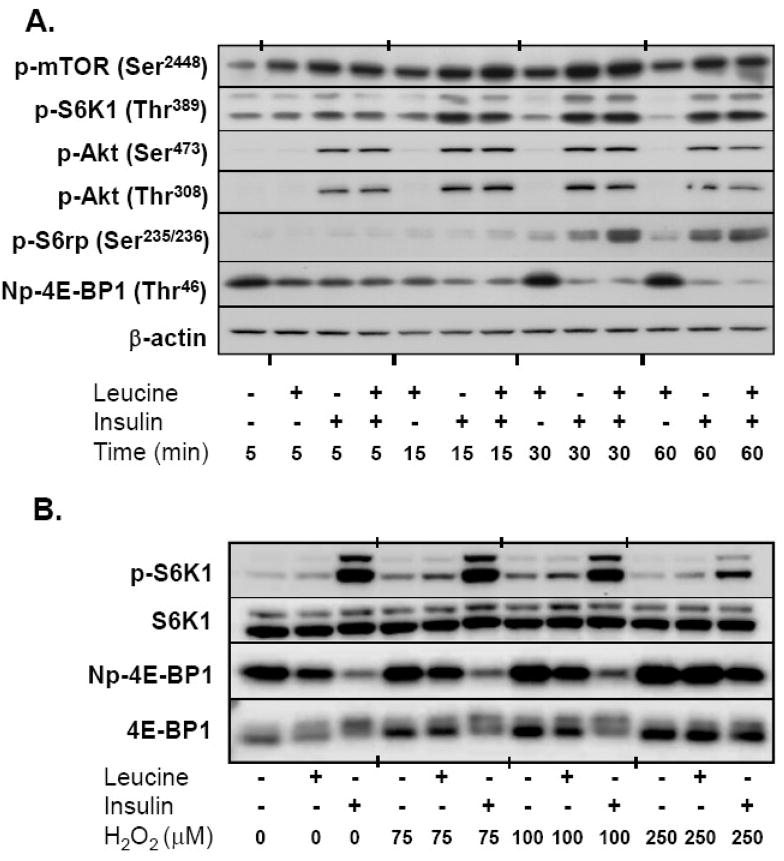
Fig. 2.
mTORC1 signaling and activity in response to leucine, insulin, and H2O2. (A) Time course of nutrient-mediated mTORC1 signaling. Serum and leucine-starved A549 cells were incubated with 0.8 mM leucine, 174 nM insulin, or both for 5–60 min. Equal amounts of whole cell lysates were separated by SDS PAGE, transferred to PVDF membranes, and immunoblotted with phosphorylation (p)-specific antibodies. Figure is illustrative of immunoblots from three independent experiments. Basal levels of phosphorylation (no insulin or leucine) were unchanged over the course of the experiment and therefore represented only at 5 min. Np-4E-BP1 = non-phosphorylated 4E-BP1 at Thr46. (B) Effect of H2O2 on the phosphorylation of downstream mTORC1 targets. Serum and leucine-starved cells were incubated with varying concentrations of H2O2 15 min prior to the addition of leucine and insulin for an additional 30 min. Whole cell lysates were separated by SDS-PAGE, transferred to PVDF membranes, and immunoblotted with S6K1, S6K1 Thr389 (p-S6K1), 4E-BP1, and Np-4E-BP1 antibodies. Immunoblot is representative of three independent experiments.

