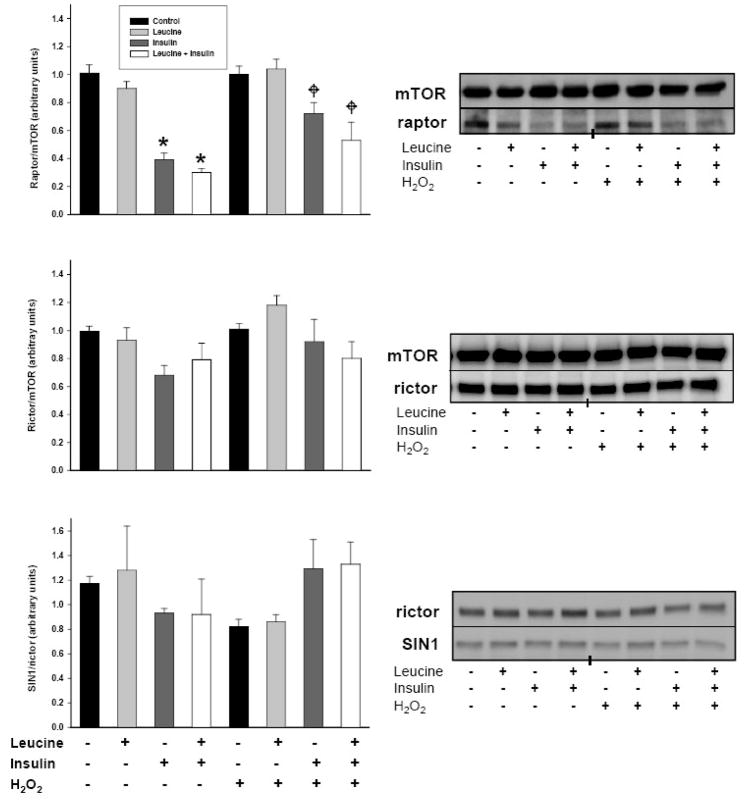
Fig. 5.
Modulation of mTORC1 and mTORC2 assembly by H2O2. Serum and leucine starved cells were lysed in CHAPS non-reducing buffer following treatment with 250 μM H2O2 and stimulation with leucine (0.8 mM), insulin (174 nM), or both for 30 min. Equal amounts of protein were then incubated with an anti-mTOR antibody and immune complexes separated using magnetic beads. Intact complexes were resolved via SDS-PAGE, transferred to PVDF membranes, and immunoblotted for mTOR, rictor, raptor, and SIN1. Immunoblots are representative of 6 individual experiments and histograms depict relative densities of each complex component relative to its binding partner. Data are presented as means ±SE. “*” identifies statistically significant differences between insulin or leucine+insulin and vehicle control, while “ ” signifies an effect of H2O2.

