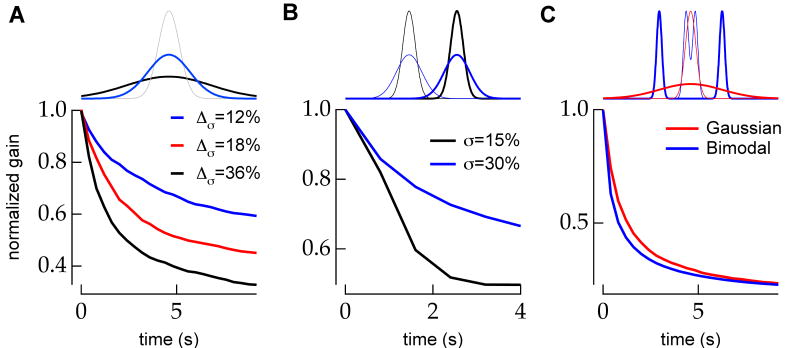
Figure 6.
The time course of model adaptation depends on the discriminability of the change in stimulus ensemble. A, The rate of model adaptation following a periodic change in contrast increases as the size of the contrast step increases. Stimulus distributions for a 12% (blue) and 36% (black) contrast step from starting contrast (gray) are shown above. B, The rate of model adaptation following an increase in stimulus luminance decreases as the signal to noise ratio of the step relative the added noise (i.e. contrast) decreases. Stimulus distributions for 30% (blue) and 15% (black) contrast at the low mean are shown above. Thin lines show the starting (low luminance) distributions. C (top), Following an increase in variance of a Gaussian distribution, many random samples from the high contrast distribution (thick red) are nearly equally likely in the low contrast (thin red) and high contrast distributions. Only rarely will a random sample from the high contrast distribution be highly unlikely in the low contrast distribution. In this case, it is difficult for an observer to infer that the contrast of the distribution has changed. The same contrast change in a bimodal distribution is easily detectable, however. If the width of the peaks is small relative to the change in their separation, as shown, random samples from the high contrast distribution (thick blue) are unlikely in the previous low contrast distribution (thin blue), and thus, a contrast change is easy to detect. C (bottom), The rate of model adaptation following a matched increase in stimulus contrast is greater for a bimodal stimulus ensemble than for a Gaussian ensemble. The model used a Gaussian likelihood function in both conditions. All traces are the average of 100 simulated trials.

