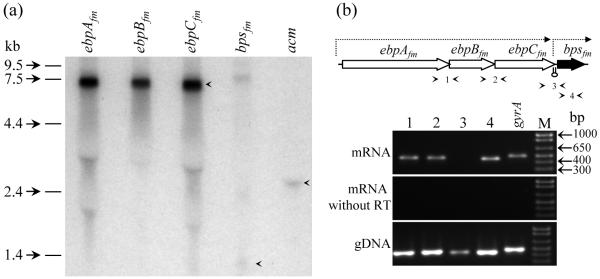
Fig. 6.
Transcriptional analysis of the ebpAfm to bpsfm gene cluster. (a) Northern hybridization of total RNA (30 μg/lane) from TX0082 probed with intragenic fragments of ebpAfm, ebpBfm, ebpCfm, and bpsfm. The acm probe was used as a control. RNA bands with expected sizes are indicated with arrows. (b) RT-PCR analysis of the ebpAfm to bpsfm gene cluster. Location of each primer pair is shown with arrows in the schematic representation of the gene cluster. A lollypop between ebpCfm and bps depicts a predicted transcriptional terminator. Top gel, RT-PCR with DNase-treated total RNA (10 ng) as template; middle gel, control reaction of the same total RNA (100ng) preparation amplified without reverse transcriptase; bottom gel, control reaction amplified with genomic TX0082 DNA as template. An intragenic region of gyrase A was used as a control. M, molecular weight marker.

