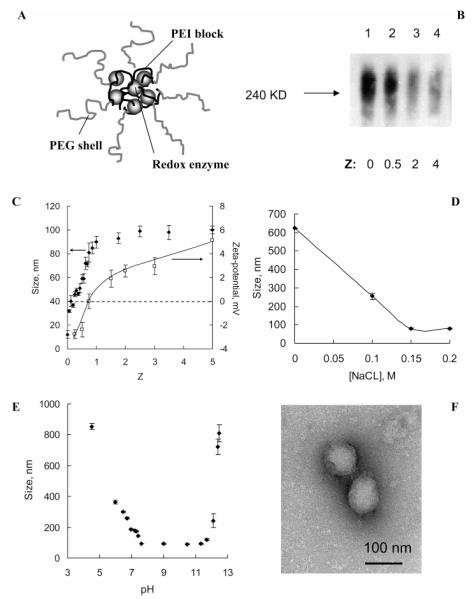
Figure 1.
Characterization of catalase nanozyme. A: Schematic presentation of the enzyme-polyion complex structure. B: Gel retardation assay of the enzyme/polyion complexes at various Z. Samples were subjected to gel electrophoresis in polyacrylamide gel (7.5%) under nondenaturing conditions (without SDS). Line 1: enzyme alone; lines 2–4: enzyme/PEI-PEG complexes with progressive increasing of Z (0.5, 2, 4). C—E: Characterization of catalase/polyion complex by DLS. Changes in cumulant diameter (C—E) and zeta-potential (C) of catalase nanozyme with various: C: Z in PBS solutions; D: ionic strength (Z = 1, pH 7.4); E: pH (Z = 1, [NaCl] = 0.15M). F: TEM images of catalase nanozyme (Z = 1). Bar represents 100 nm.

