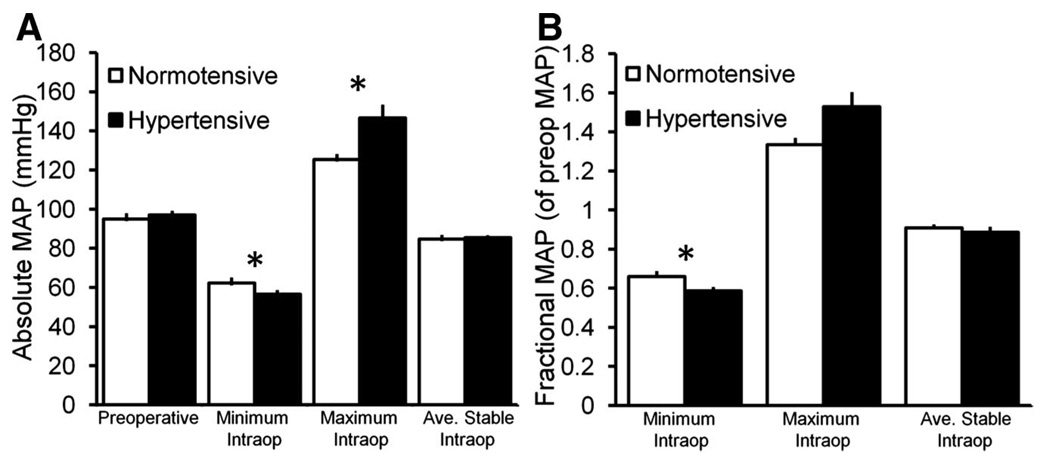
Fig. 2.
Pre- and intraoperative mean arterial pressure (MAP) measures for normotensive and hypertensive patients. (A) Mean absolute MAP measures. (B) Mean MAP measures as a fraction of preoperative MAP. Hypertensive patients had a significantly lower absolute minimum, higher absolute maximum (A) and lower fractional minimum (B) intraoperative MAP than normotensive patients. (*denotes statistically significant difference between normo- and hypertensive patients by Mann–Whitney U test. Error bars = SE. Ave. = average, intraop =in-traoperative.)

