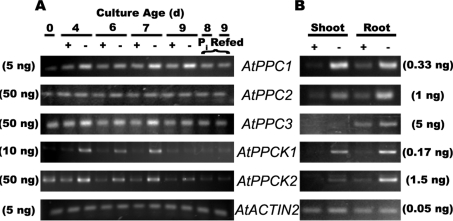
Figure 1. Semi-quantitative RT–PCR analysis of AtPPC1–AtPPC3, and AtPPCK1 and AtPPCK2 gene expression in +Pi and −Pi Arabidopsis suspension cells (A) and seedlings (B).
Levels of mRNA were measured using primers specific for AtPPC1–AtPPC3, AtPPCK1 and AtPPCK2, and AtACTIN2. AtACTIN2 was used as a reference to ensure equal template loading. All PCR products were measured at cycle numbers determined to be non-saturating. Template concentrations needed to achieve non-saturating conditions for primer pairs as tested for −Pi cells or roots of −Pi seedlings are indicated in parentheses. Control RT–PCR reactions lacking reverse transcriptase did not show any bands. ‘Pi refed’ (A) denotes 7-day-old −Pi suspension cells that were supplied with 2.5 mM Pi and cultured for an additional 24 and 48 h. d, day.

