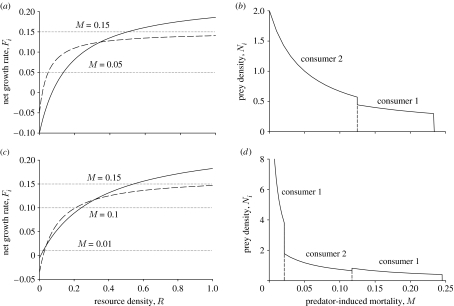
Figure 1.
(a) The per capita growth rate of two consumers in the absence of predation (Fi), as a function of R. Consumer 2 is better at resource exploitation at low resource levels, while consumer 1 is better at higher resource levels. Solid curve, consumer 1; dashed curve, consumer 2. (b) Patterns in abundance along a linear mortality gradient. We assume an abiotic resource with a constant input rate. At low mortality, consumer 2 outcompetes consumer 1, but eventually, as mortality increases, consumer 1 becomes dominant. The resource has a constant input rate of 0.1. The consumption functions are Type II functional responses with attack rates 2 and 4 and handling times 3 and 5 for consumers 1 and 2, respectively. The densities of both consumers are measured in units of the resource, and the intrinsic mortality is 0.1 for consumer 1 and 0.05 for consumer 2. Owing to the Type II functional responses, the maximum growth rate of consumer 1 is 0.2333 (the reciprocal of the handling time minus the intrinsic mortality). As M approaches this level, the equilibrium R needed to sustain the consumer increases without bound, and the consumer density approaches 0.3 (product of the resource input rate and handling time). When M reaches the critical level, the consumer consumption cannot match its mortality, so its density suddenly goes to 0, as shown. (c,d) Same as (a) and (b), but now consumer 1 is better at both low and high resource levels. The attack rates are 0.75 and 2, the handling times 4 and 5, and the intrinsic mortalities 0.005 and 0.035 for consumers 1 and 2, respectively (other parameters the same as (a,b)).

