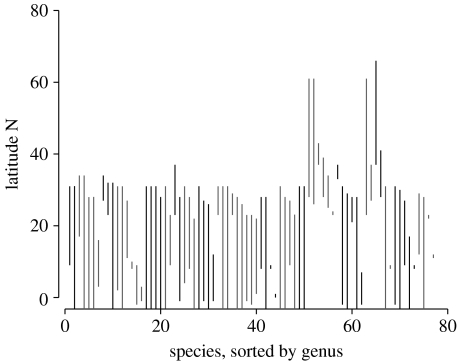
Figure 2.
A plot showing the distribution of the northern range limits of the species of the family Veneridae along the NE Pacific. The top of each line represents the northern limit of that species. Clusters of species with the same line type represent individual genera and only non-monotypic genera are shown. The lines that intersect the x-axis represent the species whose southern limits are south of the equator. In this case, the test for phylogenetic conservatism is marginally significant (p=0.07), although the power of the test is low because of small sample size.

