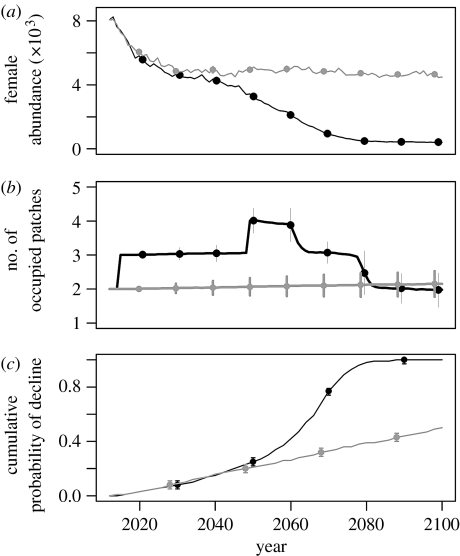
Figure 1.
Predicted status of the R. diazi metapopulation: (a) female abundance, (b) number of occupied patches and (c) cumulative probability of decline to fewer than 1000 females. For each diagnostic, two scenarios are presented: dynamic climate change (black line) and a static climate (grey line). Error bars, based on 10 000 stochastic model iterations, are presented for every 10th year only with the two scenarios offset by 1 year for clarity.

