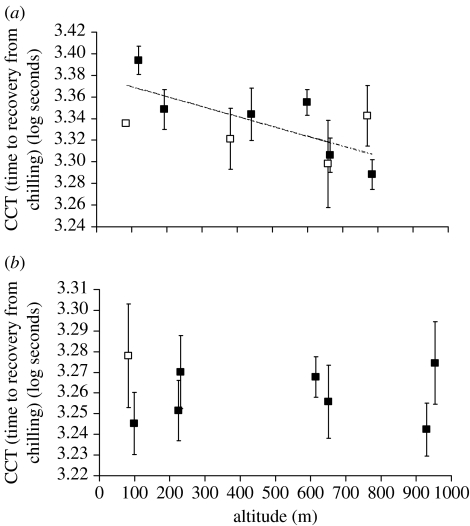
Figure 1.
The relationship between altitude and the site mean of CCT for (a) the Kirrama (72 isofemale lines) and (b) Paluma transects (74 isofemale lines). Error bars represent standard errors. The linear regression at Kirrama is significant (F1,8=8.52, p=0.019; R2=0.52). Sites represented by less than five lines are represented by open squares.

