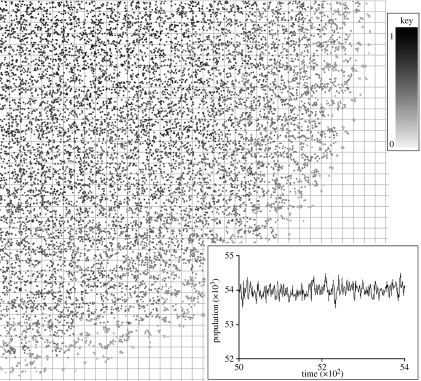
Figure 1.
One-quarter of a realization of the increasing cost of dispersal simulation model. Individuals are shown as small squares shaded by their evolved dispersal strategies from light grey (zero) to black (one or more). In this realization, the overall mean evolved dispersal strategy is 0.42 and variance in dispersal strategy is 0.046. Faint lines show the scale of the habitat patch grid relevant to some scenarios. The inset shows population size from time step 5000 through 400 time steps.

