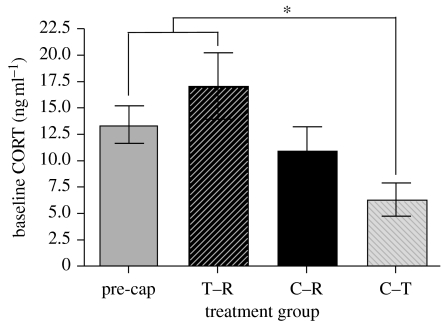
Figure 2.
Mean±s.e. of baseline CORT concentrations (sampled within 3 min) for initial capture of individuals in the pre-capture group (pre-cap, n=35), and upon first recapture of individuals in the trap–release (T–R, n=20), captivity–return (C–R, n=21) and captivity–translocate (C–T, n=12) groups. The asterisk indicates statistical significance between the C–T and pre-cap and T–R groups.

