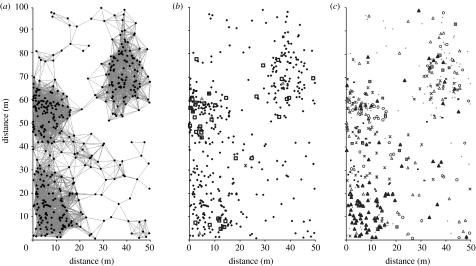
Figure 2.
Maps of 0.5 ha near LEP seedling plot. (a) Visualization of the three seedling patches around three reproductive trees by 9 m connectivity matrix. Locations of patches 1, 2 and 3 are lower left corner, middle and upper right corner, respectively. (b) Locations of locally produced seedlings by the reproductive trees at the centre of each patch. The only seedling from the tree I-85 is shown by a star (pluses, seedlings; triangles, trees; open squares, LEP35-05; plus squares, LEP32-09; asterisk, I-85). (c) Genetic origins of seedlings according to the type of forest where a parent or parent pair is found within the entire 43 ha study area. Black triangles, SG/SG; asterisks, OG/SG; plus squares, OG/OG; grey triangles, trees; circles, parent OUT; diamonds, ambiguous; open triangles, single SG; minuses, LOC mating; grey squares, single OG.

