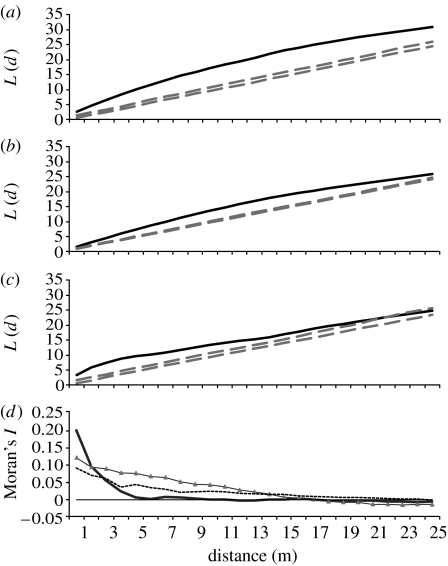
Figure 4.
(a–c) Edge corrected Ripley's K-test for spatial randomness of seedling distribution in three 0.5 ha plots ((a) Far LEP plot, (b) near LEP plot and (c) OG plot). Data values between the 95% confidence envelopes (dashed lines) indicate spatial randomness. (d) Moran's I spatial autocorrelation test for measuring spatial clumping in three 0.5 ha seedling plots (dashed line, far LEP plot; triangles, near LEP plot; solid line, OG plot).

