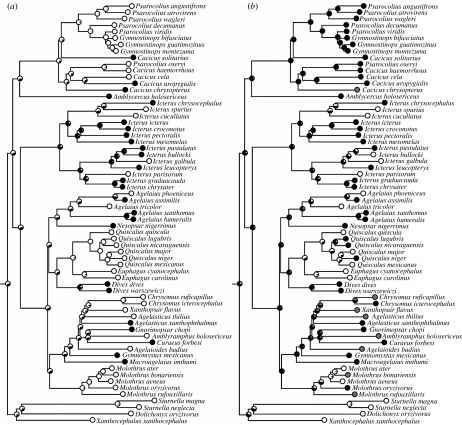
Figure 2.
Maximum-likelihood reconstructions of (a) female song rates and (b) breeding range latitudes, assuming equal rates of change between characters states (Markov k-state one parameter model). Black and white fill in circles indicate the proportional likelihoods of ancestral states. (a) Black dots, similar song rates in both sexes; white dots, females sing less than males. (b) Black dots, tropical breeding; white dots, north temperate breeding; grey dots, south temperate breeding.

