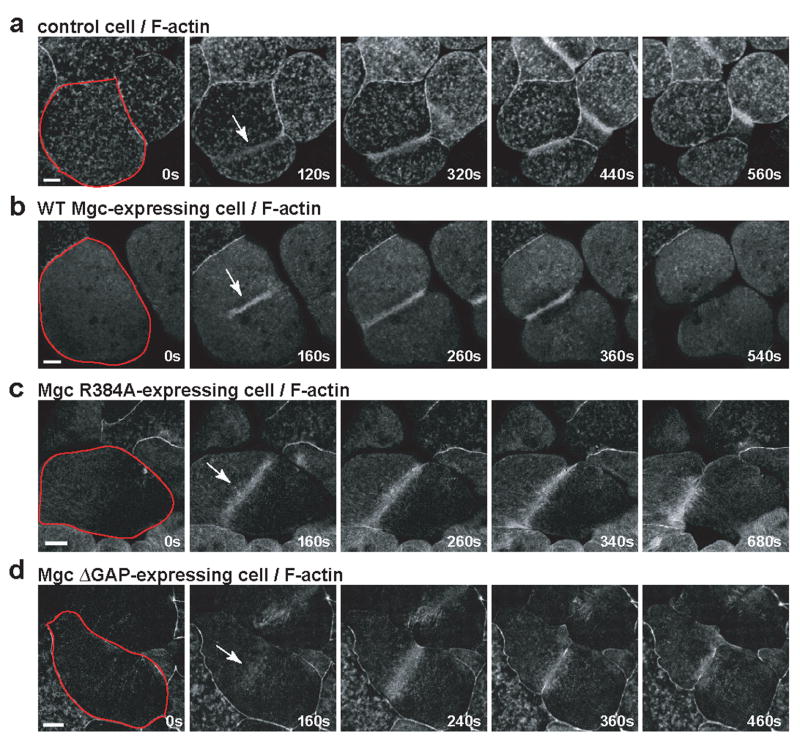
Figure 3. Downstream consequences of abnormal GTPase flux.
a–d, Embryos were injected with GFP-UtrCH to monitor F-actin along with WT Mgc (b), Mgc R384A (c), or Mgc ΔGAP (d) and imaged during cytokinesis. Frames taken from time-lapse movies are shown. A single blastomere is outlined in red in the first frame, and the Rho activity zone is marked with an arrow in the second frame. Scale bars, 40 μm.

