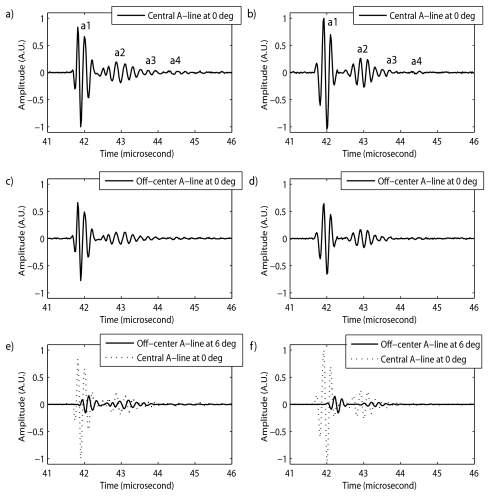
Figure 2.
Comparison of experimental and simulated rf A lines for longitudinal scans. Left column displays A lines from gel pad experiments. Right column displays the corresponding simulated A lines. (a) and (b) A lines from the center of a seed at 0°. (c) and (d) Off-center A lines from a seed at 0°, showing lower peak amplitudes. (e) and (f) Off-center A lines from a seed at 6°, showing the delays introduced to model tilting of the seed. Central A lines from a seed at 0° are shown for reference.

