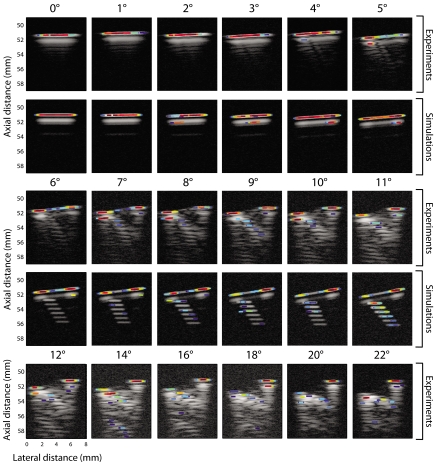
Figure 5.
(Color online) Longitudinal P-mode images of a seed in a gel pad at different angles with corresponding simulations. The first, third, and fifth rows display experimental data from 0° to 22° of seed tilt. Second and fourth rows show simulated B-mode images from 0° to 11° of seed tilt. All scans are 8 mm across, and the P values have a dynamic range of 40 dB.

