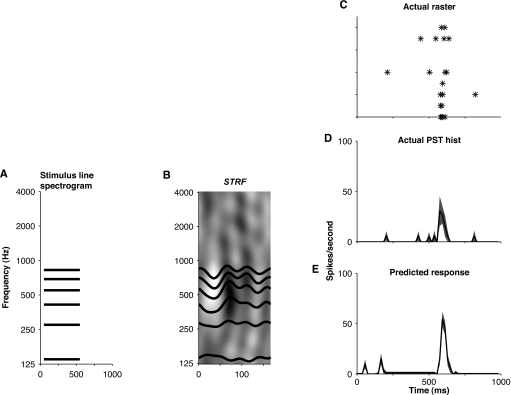
Figure 5.
Predicting responses to complex tones using STRFs. The predicted response (E) is the convolution of the spectrotemporal envelope of the stimulus (A, schematic spectrogram for complex tone having six components) with the STRF (B). More specifically, the operation can be seen as comprising two steps: (1) One-dimensional convolutions between the stimulus envelope (trapezoid-like with 10 ms cosine-squared onset and offset ramps) and horizontal slices of the STRF corresponding to the frequencies of each tone component; (2) Average of the results of the convolutions. These steps form part of an implementation of Eq. 4. Shown for comparison with the prediction are a raster plot (C) and a PST histogram (D) of the actual response of the neuron for ten stimulus presentations. Shading in D and E indicates one standard deviation above and below the mean prediction and the mean PST histogram, respectively, obtained with the bootstrap technique. The units of the STRF depicted in B are spikes∕s∕Pa. White pixels in the STRF indicate suppression, gray pixels indicate no change, and black pixels indicate elevation of discharge rate. Unit d‐46d, class 1.

