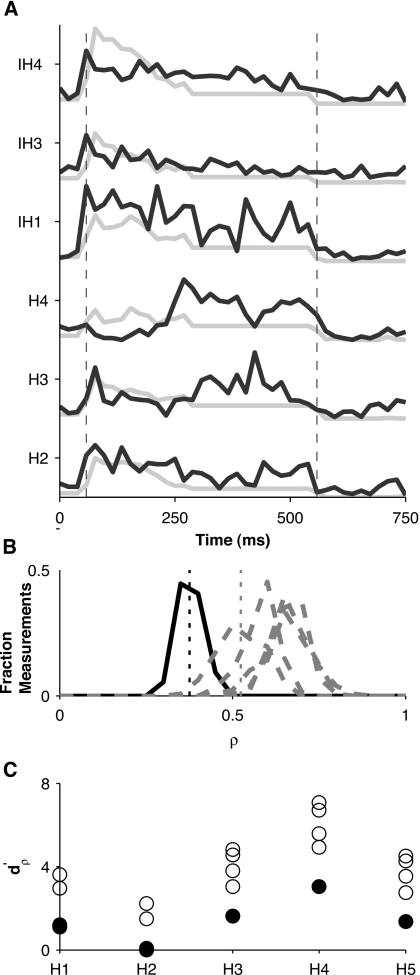
Figure 7.
Predictability of temporal patterns of discharge for unit of Fig. 6. (A) Actual (solid) PST histograms overlayed on predicted (dotted) PST histograms for some select stimuli in the anchored-tone sequence. Dashed vertical gray lines indicate stimulus onset and offset. Predictions are normalized by the maximum across stimuli of all prediction waveforms and actual PST histograms are normalized by the maximum across stimuli of all actual responses, because the magnitudes of the predictions are consistently greater than the magnitudes of the PST histograms. (B) Histograms of the correlation coefficient (ρ) between predicted and actual PST histograms for harmonic stimulus H4 (solid) and histograms of ρ for each of the inharmonic stimuli (dashed), where histograms are obtained from 128 bootstrap replicates of predicted and actual responses. Dotted vertical lines indicate means of the distributions of ρ for stimulus H4 and for the inharmonic stimulus whose response predictability was closest to that of H4. is the difference between such means normalized by the geometric mean of their standard deviations. (C) for each of the harmonic tones relative to each of the inharmonic tones. The minimum for a given harmonic number (solid circles) is a measure of how discriminable that particular harmonic tone is from the most similar inharmonic tone in terms of the predictability of the temporal discharge pattern.

