Figure 3.
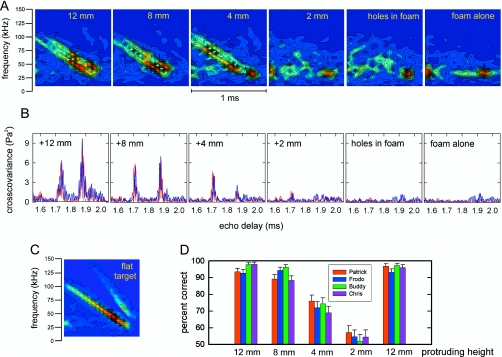
(A) Spectrograms of reflections from the target at an orientation of 50° [see Fig. 1B] for different amounts of protrusion of the cylinders above the surface of the foam disk. The double sweeps in these spectrograms trace the separate reflections from the cylinders, which are oriented so their echoes arrive about 180 μs apart (see C for reference). (B) Output of matched filter (cross correlation receiver with full-wave-rectified plots) for the same series of reflections as in A. Red and blue curves trace outputs from left and right microphones (see Fig. 2). The twin peaks in the cross covariance curves register the separate reflections from the cylinders, while their heights have the same scale to indicate relative target strength. (C) Spectrogram for the specular reflection from a flat target oriented perpendicular to the sound from the loudspeaker (Fig. 2). The sweep pattern in C is for reference to the spectrograms in A, which show two closely spaced, overlapping sweeps from the two cylinders. The plots are labeled with the target’s protrusion height (12, 8, 4, or 2 mm and empty holes). The empty holes and the blank foam surface produce acoustic scattering (clutter) across the same time window as the echoes from the target. (D) Performance (percent correct responses) of four big brown bats in detection task with different amounts of cylinder protrusion. Performance closely mirrors visibility of the FM sweeps in the spectrograms (A) or the prominence of the peaks in the cross covariance curves (B).

