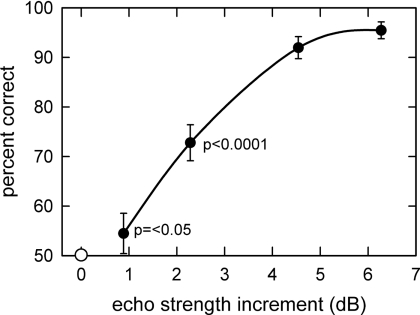
Figure 4.
Graph showing the mean performance of all four bats for different increments in target strength expressed in decibels relative to the target strength of the holes alone. Target strength is the energy reflected in a 250 μs integration-time window around each cylinder’s reflection delay [see Fig. 3B], expressed in decibels relative to the energy reflected by the holes in the same time window. The bat’s performance was significantly greater than chance (p<0.05) for echo increments greater than 1–2 dB.

