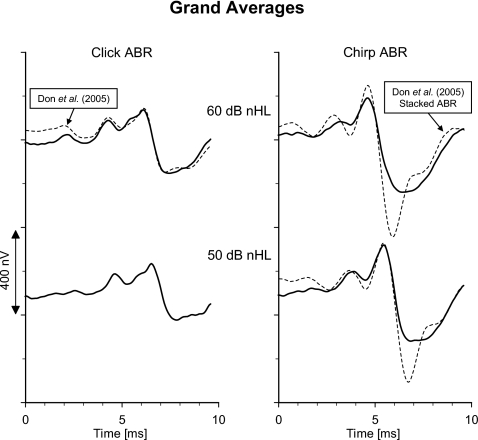
Figure 10.
Grand average waveforms of click ABR (left) and chirp ABR (right) obtained at 60 and 50 dB nHL (N=20 ears). The corresponding grand averages of the click ABR and the modeled Stacked ABR obtained from the original recordings at 60 dB nHL by Don et al. (2005) are shown for comparison (broken lines): left, click ABR; right, modeled Stacked ABR. These latter waveforms are scaled and time shifted as described in detail in the text.

