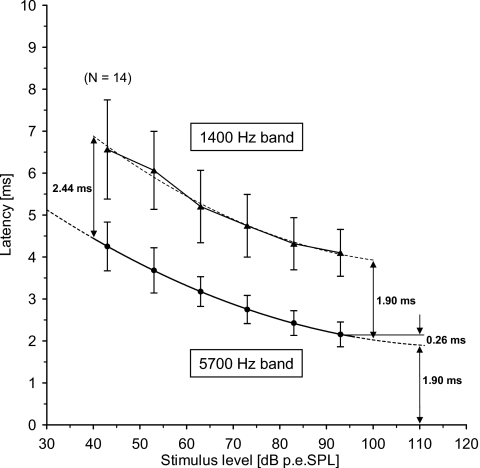
Figure 3.
Latencies (mean and ± one standard deviation) for the 5700 and 1400 Hz derived bands plotted as a function of click level (Table 2). The mean values for the 5700 and the 1400 Hz derived bands are each fitted to a second-order polynomial, shown by the broken lines. The polynomial for the 5700 Hz band indicates that the latency in this band flattens off at about 110 dB p.-p.e.SPL with a value of 1.90 ms; this latency is 0.26 ms shorter than the observed mean value at 93 dB p.-p.e.SPL. The latency delay between the two bands estimated from the two fitted polynomials is 1.90 ms at 100 dB p.-p.e.SPL, and 2.44 ms at 40 dB p.-p.e.SPL.

