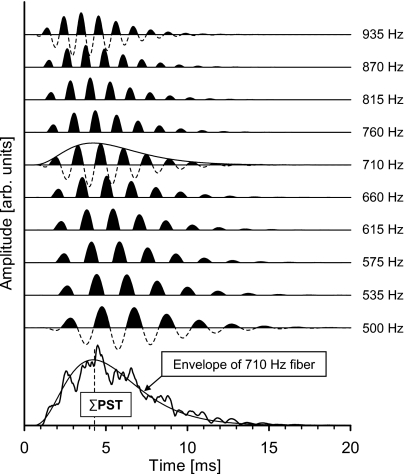
Figure 4.
(Top) Simulated activity from ten single nerve fibers, i.e., standard functions (de Boer, 1975) uniformly distributed on a logarithmic frequency scale of the low-frequency octave band. The neural activity or simulated PST histograms is indicated by the black areas. Each standard function is given a signal-front delay corresponding to the values estimated by Ruggero and Temchin (2007) and plotted in Figs. 67. (Bottom) The sum of the PST histograms (ΣPST) across the octave band (irregular curve). A scaled version of the temporal envelope of the standard function for the 710 Hz nerve fiber (the geometrical center frequency of the band) is plotted for comparison. The broken vertical line corresponds to the peak latency (4.3 ms) of the 710 Hz envelope.

