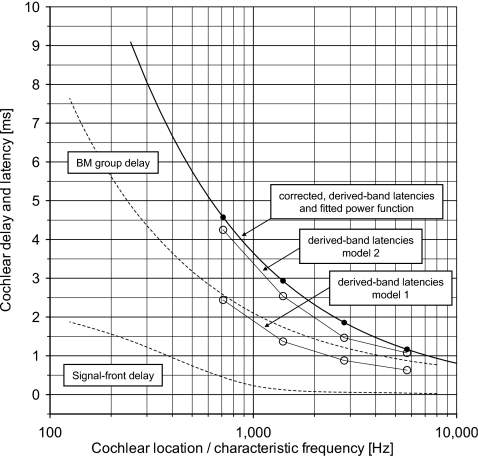
Figure 7.
Cochlear delay and latency vs cochlear location indicated by characteristic frequency. The broken lines show the signal front delay and the group delay of the BM estimated to be valid for humans at intense levels of stimulation by Ruggero and Temchin (2007, Fig. 7). The figure shows the corrected derived-band latencies (●) (Table 1, last column) and the corresponding fitted power-function model (full line). The peak latencies (○) of the two sets of modeled derived-band responses (models 1 and 2; Fig. 5, right) are also included.

