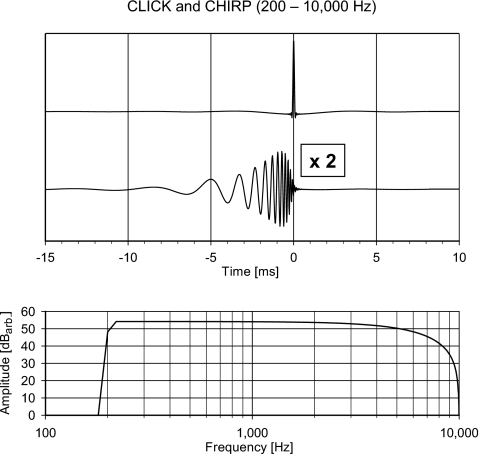
Figure 8.
(Top) The temporal waveform of the click and the chirp. The stimuli are band limited to the frequency range from 200 to 10 000 Hz. The amplitude of the chirp has been multiplied by 2. The two stimuli are temporally aligned so the phase delay at 10 000 Hz of both stimuli corresponds to 0 ms. (Bottom) The (identical) amplitude spectra of the two stimuli. The lower cutoff corresponds to −6 dB at 200 Hz and the higher cutoff corresponds to the falling spectrum of a 100 μs click, having its first null at 10 000 Hz (see endnote 5).

